Appearance
Drawing
Liii STEM provides two main drawing workflows.
The first workflow uses the built-in drawing tools. The sections below explain how to use them in different contexts.
1. Insert a Canvas and Draw
- Create a new blank drawing
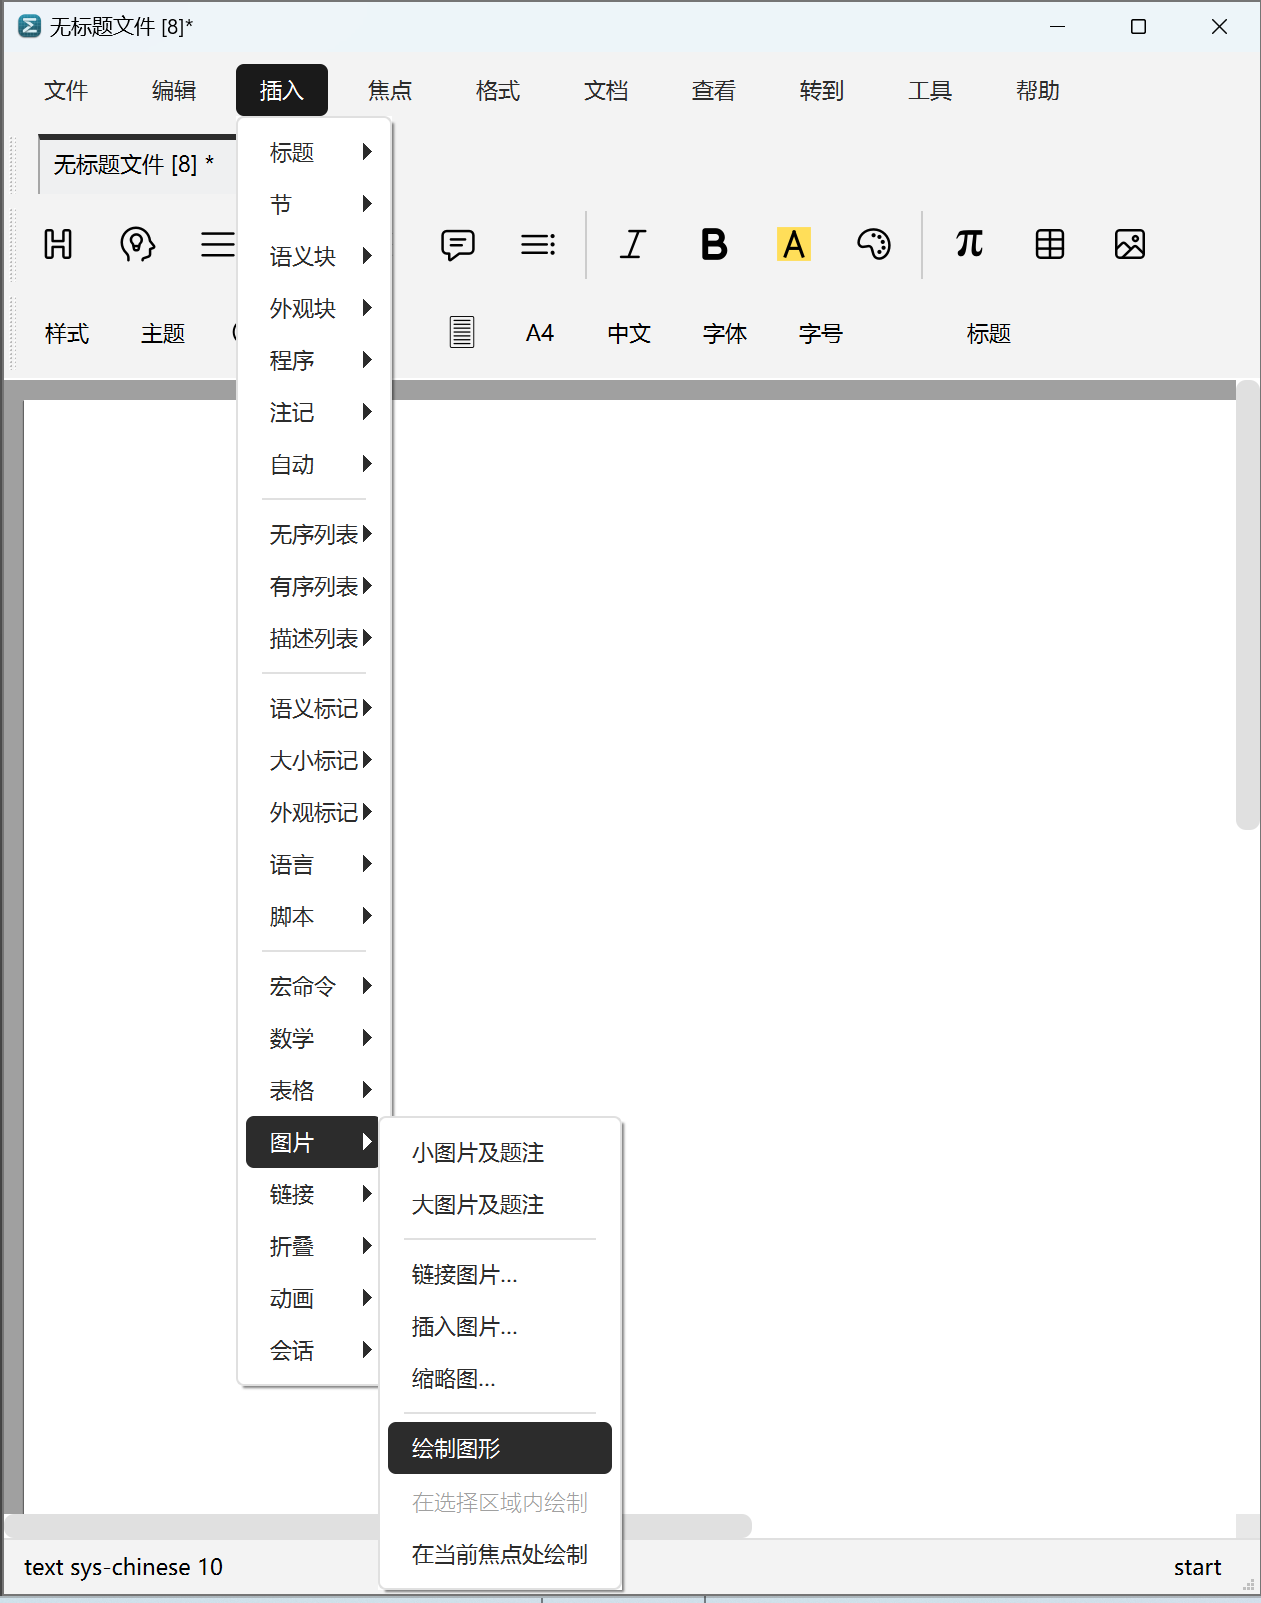
Click Insert -> Image -> Draw Graphics to enter drawing mode. The editor inserts a canvas and switches to the drawing toolbar.
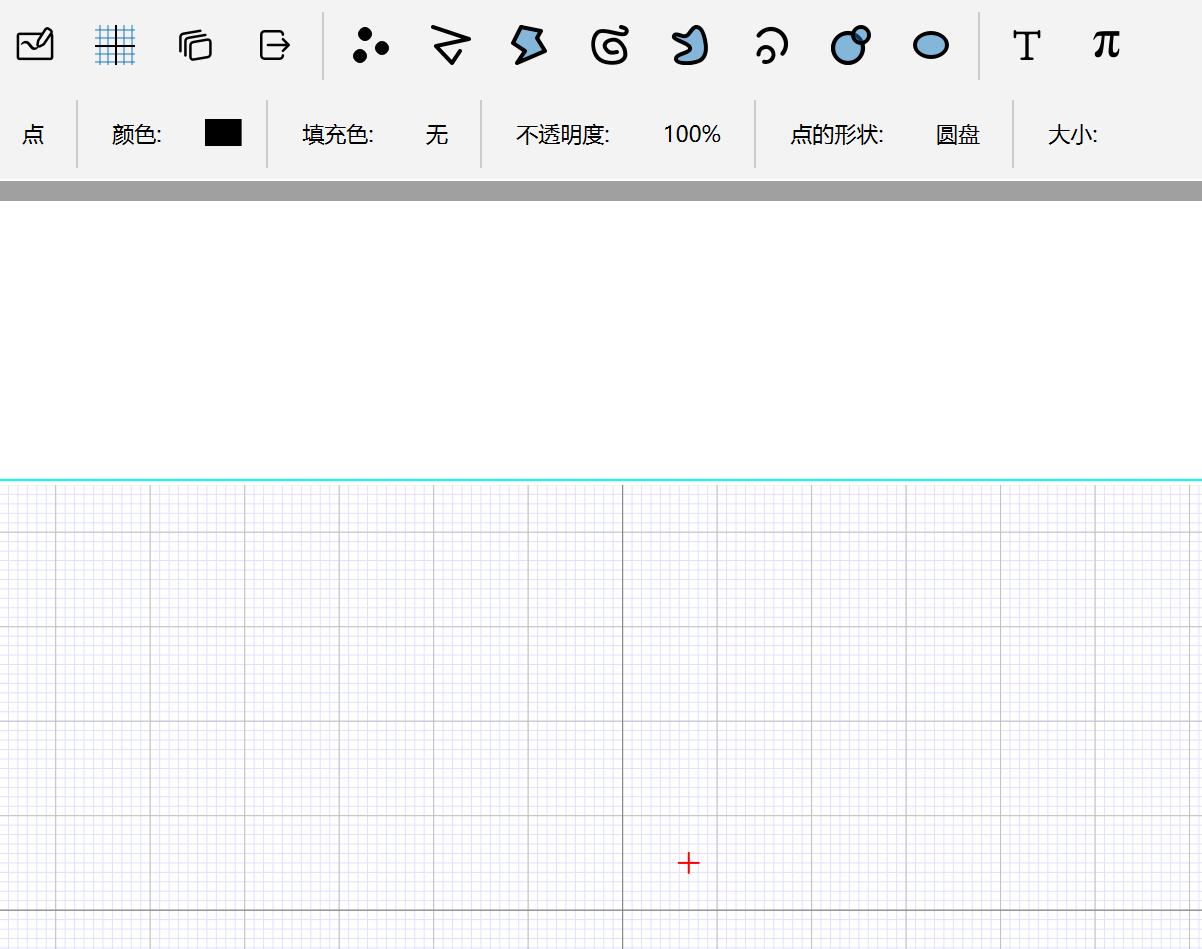
From left to right, the basic primitives on the toolbar are point, polyline, polygon, curve, closed curve, arc, circle, and ellipse.
- Click to place nodes.
- Double-click to finish the current shape.
In the second row of the toolbar, you can adjust point/line styles.
2. Draw at the Current Focus
The canvas in section 1 occupies a full line. If you only need to annotate near the cursor, use draw at focus.
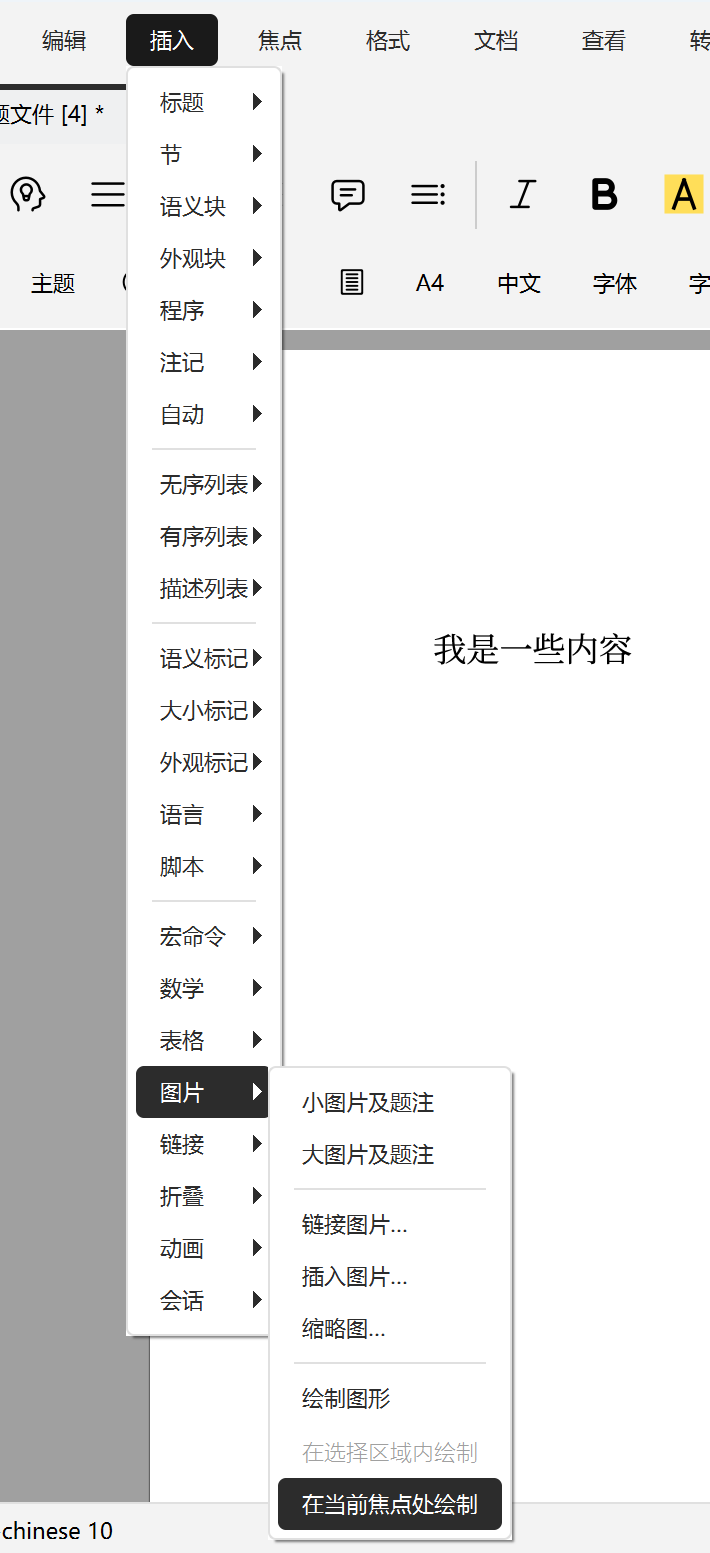
- Place the cursor where you want to draw, then click
Insert->Image->Draw Graphics at Current Focus.
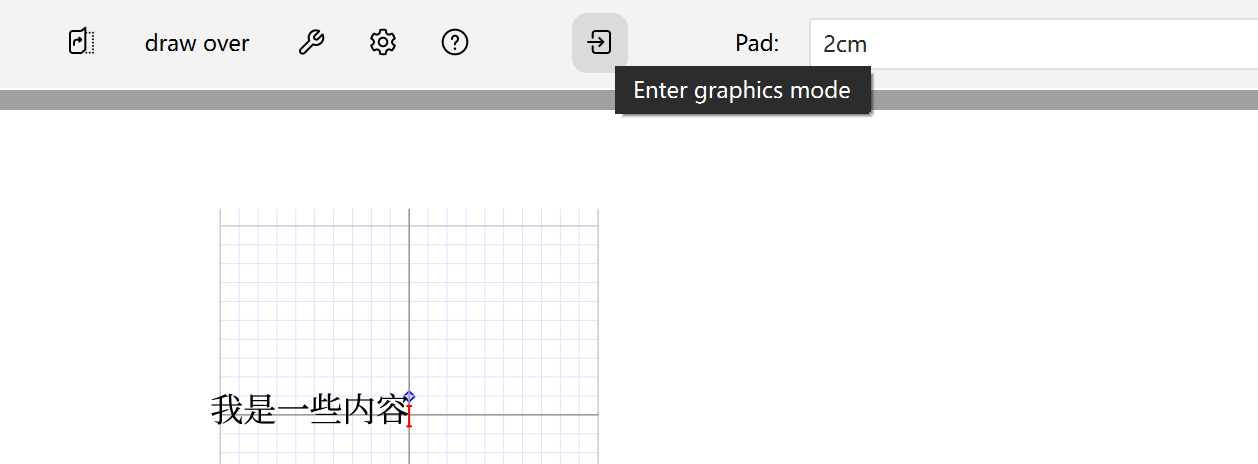
- After insertion, click
Enter graphics modeto enter drawing mode.
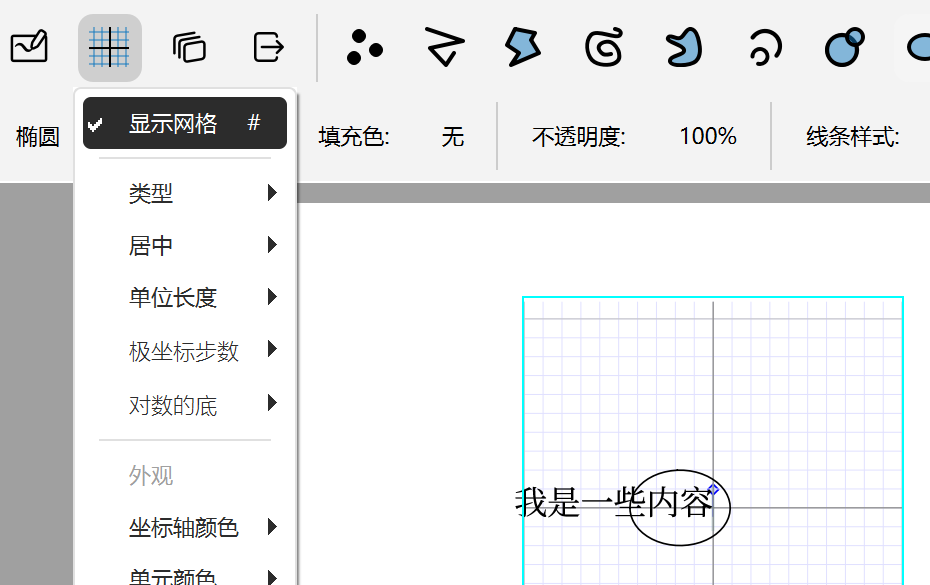
- After drawing, you can use the left-side icon to adjust or hide the grid.
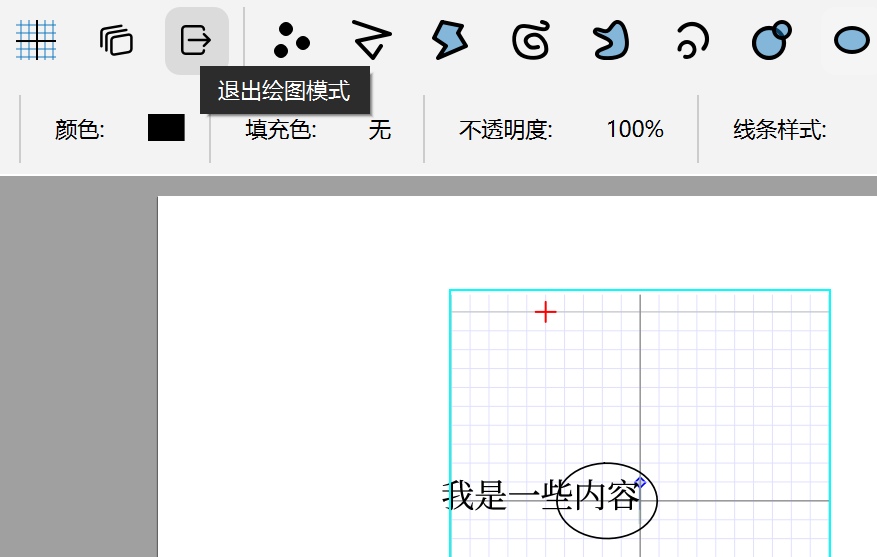
- Click
Exit graphics mode(or click blank space) to leave drawing mode.
Full animated example for this section (basic primitive operations are the same as above):
3. Draw Inside a Selected Area
Drawing at focus still creates a small canvas. If you only need to annotate selected content, use Draw Graphics in Selected Area.
- Select the target area, then click
Insert->Image->Draw Graphics in Selected Area. - Exit this mode the same way as section 2.
This feature cannot select across multiple lines. For cross-line annotation, use section 2.
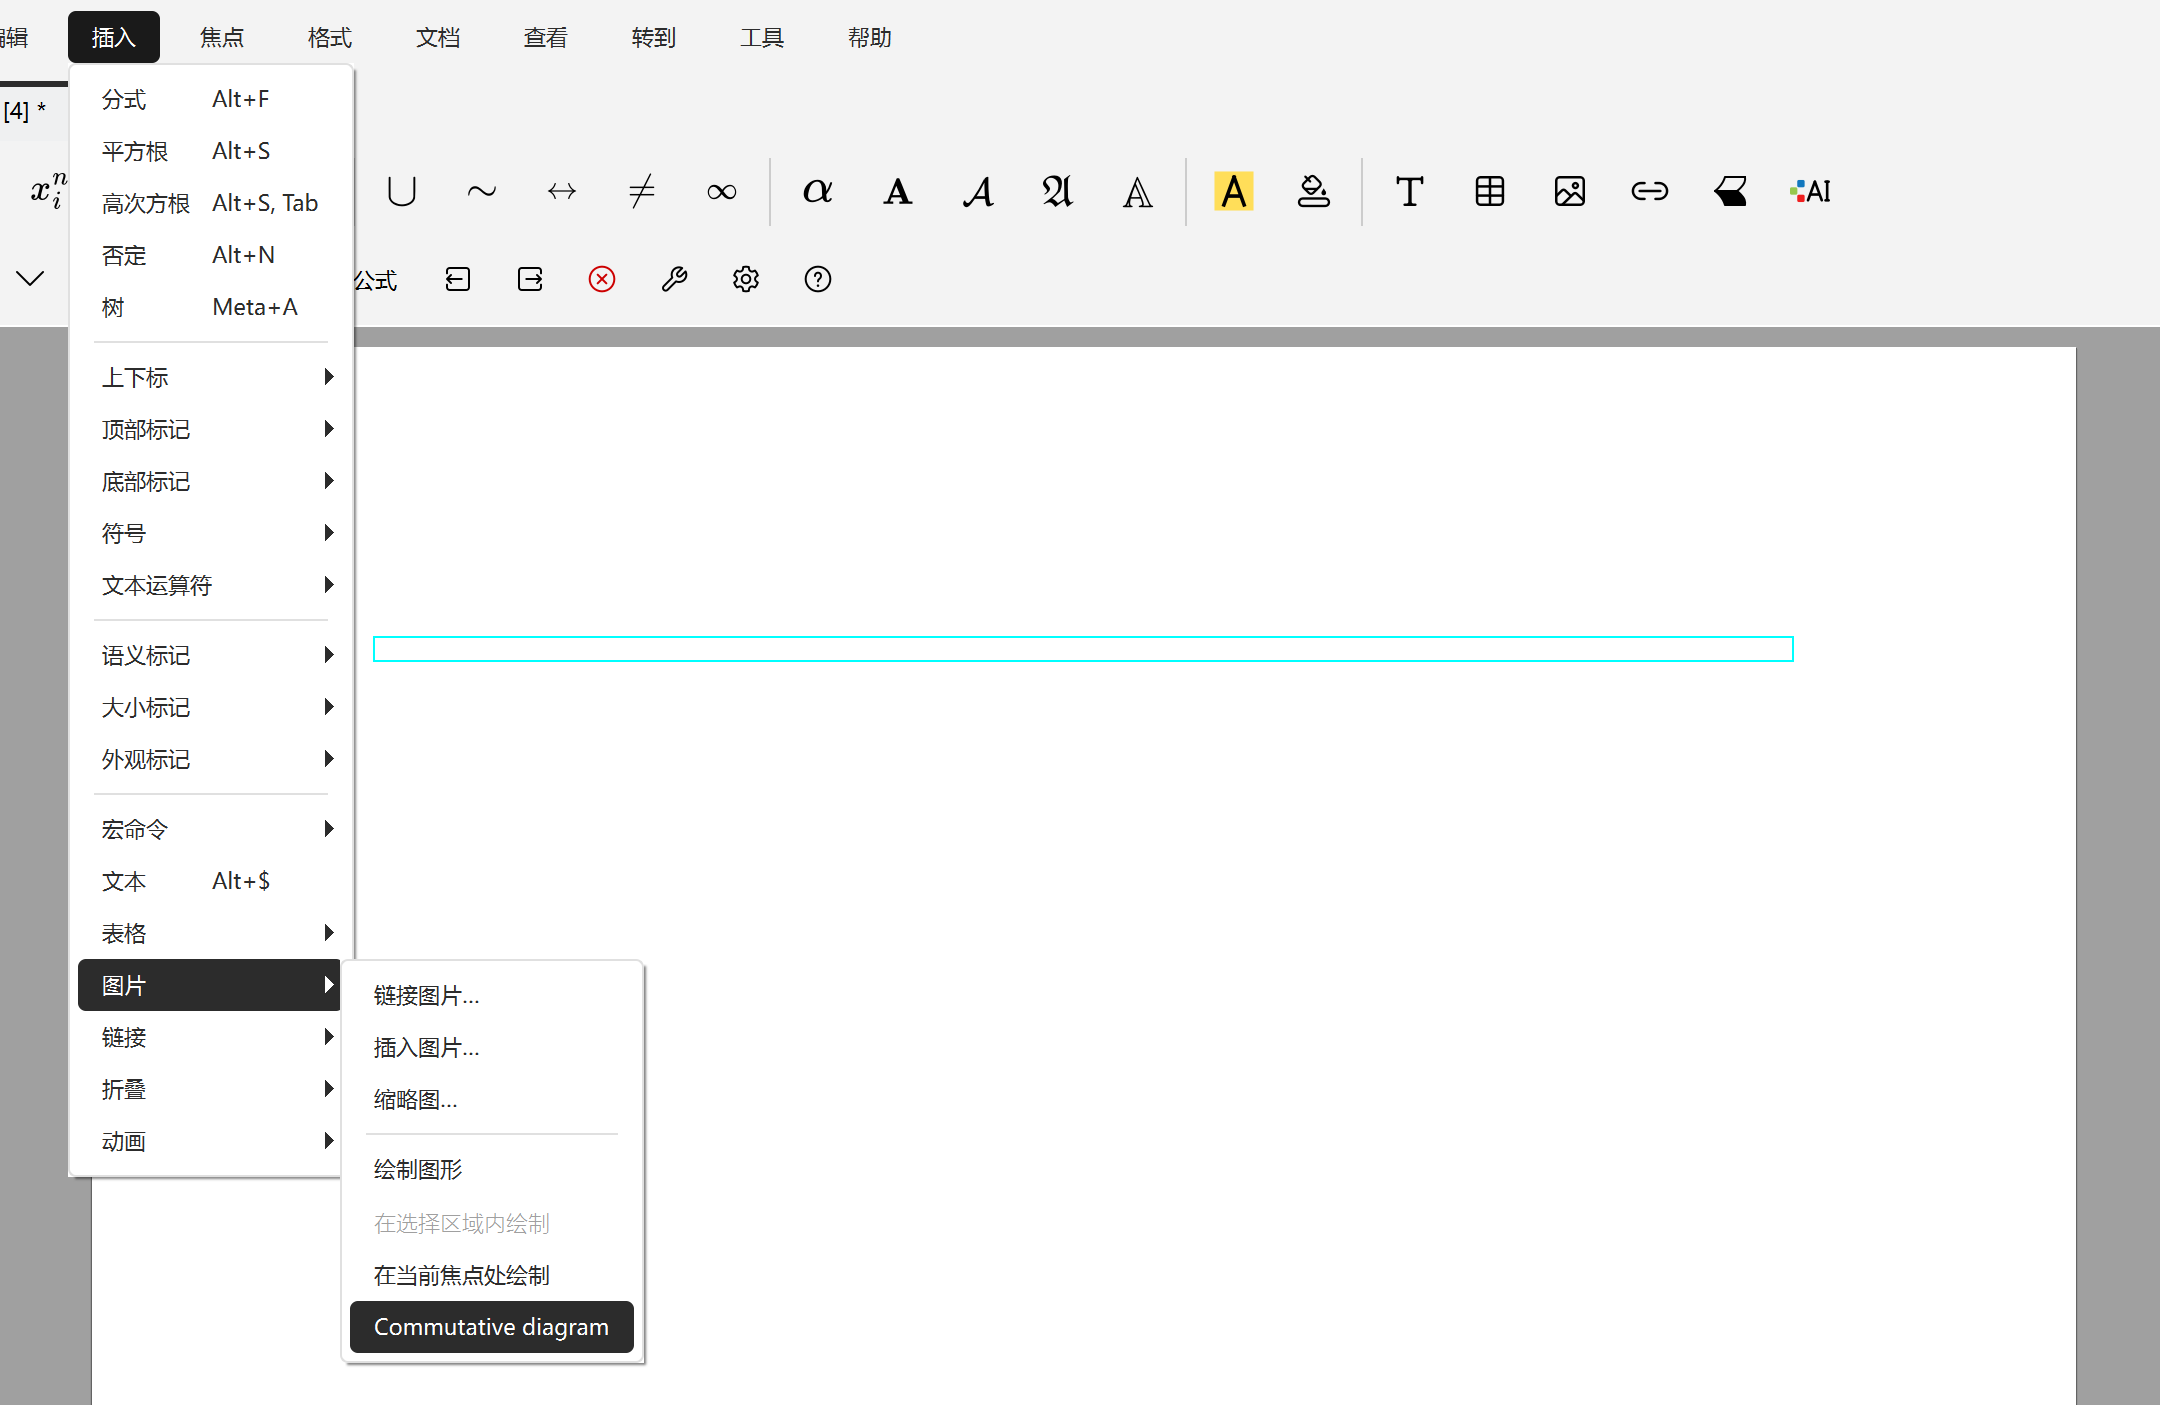
4. Draw in Math Mode
The operations above are in text mode. In math mode, you can draw commutative diagrams.
Enter math mode, then click Insert -> Image -> Commutative diagram.
The text style inside this canvas follows math mode text formatting by default.
5. Draw in Slide Style
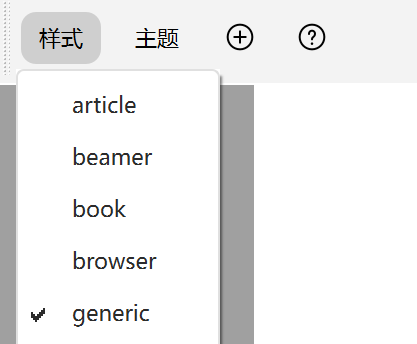
Documents are created in generic mode by default. If needed, switch to slide mode for freer drawing.
Workflow:
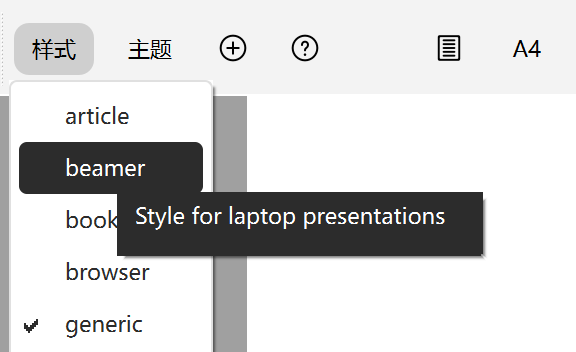
Click
Style->beamerto switch to slide mode.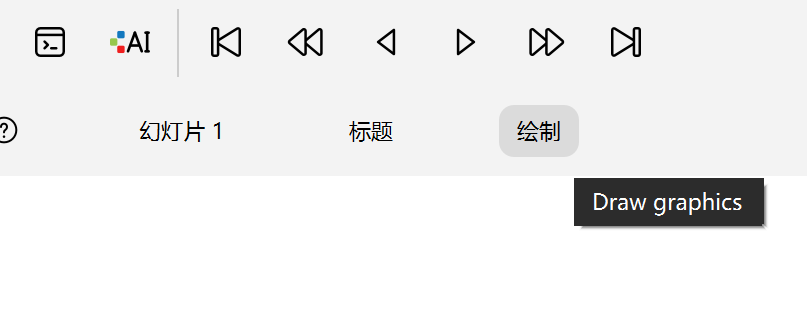
Click
Drawto enter drawing mode.
The remaining operations are similar to earlier sections.
You can also draw with
gnuplot. See Help -> Plugins -> gnuplot for details.